SILVER
 Silver moved lower overnight to open at
19.70/19.75, which was also the high of the day. It then followed
gold to a low of 19.25/19.30 prior to concluding the session at
19.28/19.33.
The gold-silver ratio traded higher,
currently at 63.60, taking out resistance in the 63.51 area. This
was the 61.8% retracement of the July-August range. We see little
resistance from here until the 67.47 level, a full retracement.
Support is at 62.28, the 50% Fibonacci level.
Silver moved lower overnight to open at
19.70/19.75, which was also the high of the day. It then followed
gold to a low of 19.25/19.30 prior to concluding the session at
19.28/19.33.
The gold-silver ratio traded higher,
currently at 63.60, taking out resistance in the 63.51 area. This
was the 61.8% retracement of the July-August range. We see little
resistance from here until the 67.47 level, a full retracement.
Support is at 62.28, the 50% Fibonacci level.
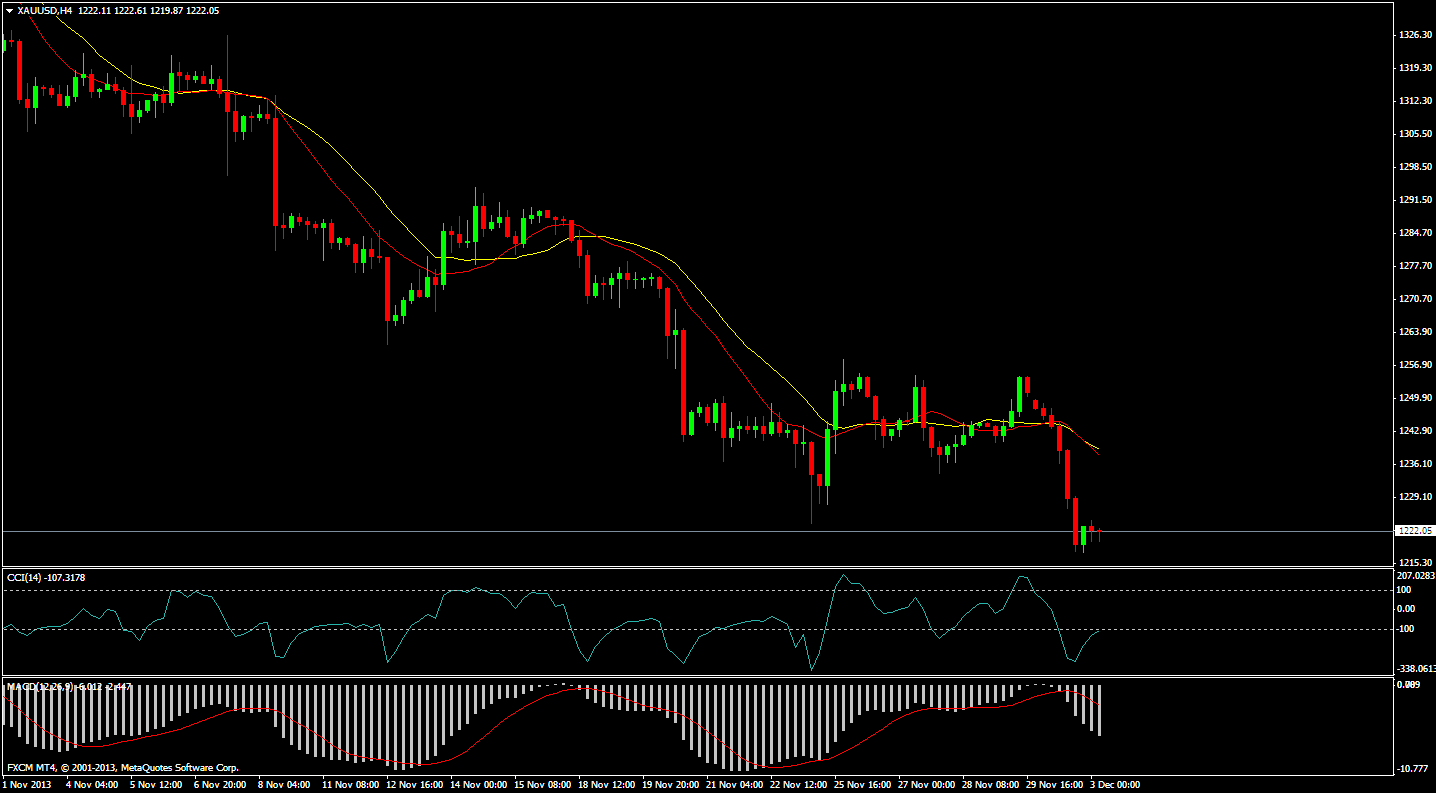
.jpg) Gold moved lower overnight to open at
1236.25/1237.25. It briefly touched a high of 1238.25/1239.25 before
retreating to a low of 1221.50/1222.50 while the dollar strengthened
following strong U.S. manufacturing data prompting short selling
from investors and speculators. Thereafter, the metal traded within
range to close at 1222.50/1223.50.
Gold moved lower overnight to open at
1236.25/1237.25. It briefly touched a high of 1238.25/1239.25 before
retreating to a low of 1221.50/1222.50 while the dollar strengthened
following strong U.S. manufacturing data prompting short selling
from investors and speculators. Thereafter, the metal traded within
range to close at 1222.50/1223.50.
 Gold dropped as better-than-expected
U.S. manufacturing data prompted funds and speculators to increase
bearish bets on bullion.
Gold dropped as better-than-expected
U.S. manufacturing data prompted funds and speculators to increase
bearish bets on bullion.
 On the Comex division of the New YorkMercantile Exchange, copper futures for March delivery traded at
USD3.193 a pound during European morning trade, down 0.4%.
On the Comex division of the New YorkMercantile Exchange, copper futures for March delivery traded at
USD3.193 a pound during European morning trade, down 0.4%.
Comexcopper prices traded in a range between USD3.188 a pound, the daily low and a session high of USD3.215 a pound.
The March contract settled 0.45% higher on Friday to end at USD3.205 a pound.
Copper prices were likely to find support at USD3.180 a pound, the low from November 27 and resistance at USD3.225 a pound, the high from November 29..
 China and the euro zone are major global
copper consumers and manufacturing numbers are often used as
indicators for future copper demand growth.
China and the euro zone are major global
copper consumers and manufacturing numbers are often used as
indicators for future copper demand growth.
 On the New York MercantileExchange, light sweet crude futures for delivery in January traded at
USD 94.17 a barrel, up 0.37%,
On the New York MercantileExchange, light sweet crude futures for delivery in January traded at
USD 94.17 a barrel, up 0.37%,
The Institute for Supply Management reported that U.S. manufacturing activity in November expanded at its fastest pace since April 2011, fueling optimism for more robust economic recovery down the road.
The ISM manufacturing purchasing managers’ index rose to 57.3 in November from 56.4 in October. Analysts were expecting the index to fall to 55.0.
 Crude oil rose after strong
manufacturing data from China and the United States, the world’s
two biggest oil consumers.Oil prices found some extra support from
evidence that the OPEC pumped less oil in November, mainly due to
decreased production in Libya.Ongoing unrest in Libya pulled exports
down to around 130,000 bpd, Deputy Oil Minister told more than 1.2
mbpd below pre-revolution supply levels.
Crude oil rose after strong
manufacturing data from China and the United States, the world’s
two biggest oil consumers.Oil prices found some extra support from
evidence that the OPEC pumped less oil in November, mainly due to
decreased production in Libya.Ongoing unrest in Libya pulled exports
down to around 130,000 bpd, Deputy Oil Minister told more than 1.2
mbpd below pre-revolution supply levels.
IBD/TIPP Economic Optimism
Silver moved lower overnight to open at
19.70/19.75, which was also the high of the day. It then followed
gold to a low of 19.25/19.30 prior to concluding the session at
19.28/19.33.
Silver had a very bad day today,
closing down sharply at 19.28, taking out support in the 19.59 area
(previous low). There is very little price support between here and
18.23, the low from June 2013. RSI is currently at 29, with support
at the previous low of 22.42, so we can see silver sell off further
before getting ‘oversold’. Resistance is at today’s high of
19.75.
Silver plunge after
stronger-than-expected U.S. manufacturing activity data reinforced
expectations for an eventual reduction in Fed’s monetary stimulus.
ISM said its index of purchasing
managers rose to a 31-month high of 57.3 in November from a reading
of 56.4 in October.
U.S. manufacturing activity rose to a
10-month high of 54.7 in November, up from a preliminary reading of
54.3
GOLD
Gold moved lower overnight to open at
1236.25/1237.25. It briefly touched a high of 1238.25/1239.25 before
retreating to a low of 1221.50/1222.50 while the dollar strengthened
following strong U.S. manufacturing data prompting short selling
from investors and speculators. Thereafter, the metal traded within
range to close at 1222.50/1223.50.
Gold suffered a steep drop today,
closing at 1222, below our support level at the major low of 1225.
Now that we have broken through the bottom of the recent trading
range, we can expect some acceleration to the downside. RSI is at 30,
with no major support until 19.74 (previous major low), so we can
see further downside before reaching ‘oversold’ levels. There is
no major price support until the next low of 1180 from June 2013.
Resistance is at today’s high of 1239.
Gold dropped as better-than-expected
U.S. manufacturing data prompted funds and speculators to increase
bearish bets on bullion.
Bullion’s losses widened after data
showed the U.S. manufacturing sector expanded last month at its
fastest pace in 2-1/2 years
Data this week including nonfarm
payrolls, third-quarter GDP and manufacturing PMI may provide more
insight into the strength of the world’s biggest economy.
COPPER
On the Comex division of the New YorkMercantile Exchange, copper futures for March delivery traded at
USD3.193 a pound during European morning trade, down 0.4%. Comexcopper prices traded in a range between USD3.188 a pound, the daily low and a session high of USD3.215 a pound.
The March contract settled 0.45% higher on Friday to end at USD3.205 a pound.
Copper prices were likely to find support at USD3.180 a pound, the low from November 27 and resistance at USD3.225 a pound, the high from November 29..
Copper futures edged lower on Monday,
as investors digesting a mixed round of manufacturing data from the
euro zone and China.
China and the euro zone are major global
copper consumers and manufacturing numbers are often used as
indicators for future copper demand growth.
Copper dropped as upbeat U.S. economic
data spurred renewed fears about the Federal Reserve trimming
monetary stimulus and the dollar strengthened.
In the euro zone, data showed that the
bloc’s manufacturing PMI rose to a two year high of 51.6 last month
from October’s 51.3
Mine output of copper has grown by
around 944,000 tonnes year-to-date, almost twice the pace of primary
refined output.
CRUDE
On the New York MercantileExchange, light sweet crude futures for delivery in January traded at
USD 94.17 a barrel, up 0.37%,The Institute for Supply Management reported that U.S. manufacturing activity in November expanded at its fastest pace since April 2011, fueling optimism for more robust economic recovery down the road.
The ISM manufacturing purchasing managers’ index rose to 57.3 in November from 56.4 in October. Analysts were expecting the index to fall to 55.0.
Oil prices in Asia held onto
overnight gains Tuesday built on data that showed industrial activity
in the U.S. and China, the world's largest consumers of crude, beat
expectations and painted a picture of a global economy poised to
demand more fuel and energy going forward.
Crude oil rose after strong
manufacturing data from China and the United States, the world’s
two biggest oil consumers.Oil prices found some extra support from
evidence that the OPEC pumped less oil in November, mainly due to
decreased production in Libya.Ongoing unrest in Libya pulled exports
down to around 130,000 bpd, Deputy Oil Minister told more than 1.2
mbpd below pre-revolution supply levels.
Technical Levels
| SUPPORT 1 | SUPPORT 2 | RESISTANCE 1 | RESISTANCE 2 | |
| GOLD | 1209 | 1196 | 1243 | 1264 |
| SILVER | 18.89 | 18.55 | 19.74 |
20.25
|
| COPPER | 3.2000 | 3.1825 | 3.2385 | 3.2595 |
| CRUDE | 92.89 | 91.37 | 94.41 | 95.00 |
Commodity Contract S3 S2 S1 R1 R2 R3
Global Economic Data
| DATE | TIME | DATA | PRV | EXP | IMPACT |
| 03.12.13 | 8.30P.M | IBD/TIPP Economic Optimism | 41.4 | 43.2 | LOW |
| 03.12.13 | ALL DAY | Total Vehicle Sales | 15.2M | 15.8M | LOW |
IBD/TIPP Economic Optimism
| Source | TIPP (latest release) |
| Measures | Level of a diffusion index based on surveyed consumers; |
| Usual Effect | Actual > Forecast = Good for currency; |
| Frequency | Released monthly, around the middle of the current month; |
| Next Release | Jan 7, 2014 |
| FF Notes | Above 50.0 indicates optimism, below indicates pessimism; |
| Derived Via | Survey of about 900 consumers which asks respondents to rate the relative level of economic conditions including six-month economic outlook, personal financial outlook, and confidence in federal economic policies; |
Total Vehicle Sales
| Source | Autodata Corp. (latest release) |
| Measures | Annualized number of cars and trucks sold domestically during the previous month; |
| Usual Effect | Actual > Forecast = Good for currency; |
| Frequency | Released monthly, about 2 days after the month ends; |
| Next Release | Jan 2, 2014 |
| FF Notes | Listed as an 'All Day' event because the 'Actual' is comprised of data from major auto manufacturers which report their sales figures throughout the afternoon. While this is monthly data, it's reported in an annualized format (monthly figure x12); |
| Why Traders Care |
It's a sign of consumer confidence - rising demand for expensive durable goods shows that consumers are confident in their future financial position and feel comfortable spending money; |
| Also Called | Total SAAR; |
| Source | Autodata Corp. (latest release) |
| Measures | Annualized number of cars and trucks sold domestically during the previous month; |
No comments:
Post a Comment